Panoremo: A tool to assess the emotional experience of environments

Relevant Keywords:
Evaluating emotions, environments, services, consumer experience, online application, prototyping
Design Goal:
During my Design for Interaction MSc. graduation project a concept was developed that was deemed very interesting and promising for the potential assessment of emotions experienced towards a physical environment. This concept was later developed even further in collaboration with SusaGroup in order to bring it into the market as a fully functional instrument that can aid in emotional design research.
Methods Used:
- Early prototyping to perform user testing of working principle.
- Software development.
- Usability testing.
THE PROJECT:
Early conceptualization and prototyping
Using a panoramic 360 degrees view of an environment in a computer based application, an interface can be deployed which gives the respondent the opportunity to pin-point those things for which he has an emotional reaction and to identify which emotion it is that he feels towards this selected location.

First prototype of Panoremo with a few emotional markers placed by a user
The tool could be implemented in electronic kiosks or other types of interactive screens within the location itself, with a panoramic view relevant to where they are placed, for example a view of a hotel lobby on a kiosk set in the hotel itself, or as an online survey which can be sent via e-mail to your panel of target users to receive their feedback.
An initial prototype was developed using Adobe Flash and an interface baring the LEM characters (one of SusaGroup’s products) was used to allow the user to report the emotion that he feels.
To evaluate the concept and the types of results that can be gathered with the tool, a pilot test was set up by using the cafeteria of the Industrial Design Faculty at the Delft University of Technology as a test environment.
The application was placed online and a total of 30 students and faculty staff members took part of the test. Later on, 10 of them were approached with a 5 question survey to ask for their opinion about the tool and the way they used it.
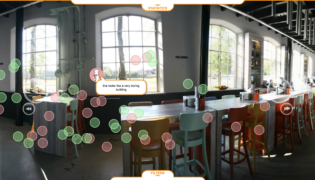
The results from all 30 participants were placed on a single panoramic image (dubbed an emotional panorama) to allow for a better comparison of the emotions and locations chosen by all the participants (see below).

An emotional panorama with highlights of two emotional hotspots
The formatting of the results in the form of the emotional panorama of the setting works as a very powerful tool in the identification of locations with a highly emotional focus which can be used for latter, more in depth analysis of these locations, as can be seen from the two examples circled above in the emotional panorama, where a high number of emotional markers are concentrated in a very small space, even though the respondents could not see where other people had clicked.
The results of the pilot test and the survey were used to improve the interface of the tool, in which for example a new feature was added in order to allow respondents to add a short text description explaining why they felt a certain way.
An application was also developed that would help in visualizing the results in an easy way, by automatically placing all the collected emotional markers onto the panoramic view and allowing the user to apply filters to the markers he would like to visualize.
Description of the final design

How does it work?
Using Panoremo is easy. You can try if for yourself at Panoremo.com.
- Move: Use the arrows left and right in the image to move around in the environment
- Spot: If you see something (anything) that draws your attention (positively or negatively), indicate it by…
- Indicate: Click and drag the character found at the top of the interface onto the point of the panorama view which you want to indicate
- Rate: A circular interface pops up in which you can express how you feel towards that spot by selecting the relevant character from a selection of caricatured emotions.

- Explain: In a few words explain why you feel like that and click on the green tick to save


You will be able to see all characters you dropped and read the text by hovering on top of it using your mouse.
The outcome
The outcome of a Panoremo exploration is a reflection through the hotspots that have been identified by people. Since there is no predefined research question or study script, the highlights that you see are those that have been selected by respondents. These will give you an instant insight in the emotional experience of the environment that was assessed.

Emotion clustering
Areas that show many emotions that are clustered together should be of special interest to you as a designer, researcher, marketeer or salesperson.
You can then further analyse and explore results by only displaying certain emotions, comments or even individual reactions. This can be done with the filter option in the PanorEmo Hotspots interface.

Applying filters to the results obtained from a Panoremo study
And you can also visualize some basic statistics of your study, like for example the amount of emotional markers, or the percentage of positive emotions as opposed to negative ones.

Basic statistics offered by the Panoremo Hostpots application
SUPPORTING MATERIAL:
Documents (PDF)
Prototypes

Panoremo – Reporting tool
Panoremo – Hotspots